


The Problem

No Information:
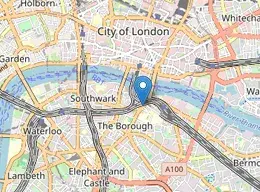
You have no idea where your posters are actually working, and where people are just walking past.

No Record:
If you find a great spot, you have no way of remembering where it is for your next poster campaign.

No System:
All your marketing information is spread across countless docs and websites.



The Solution
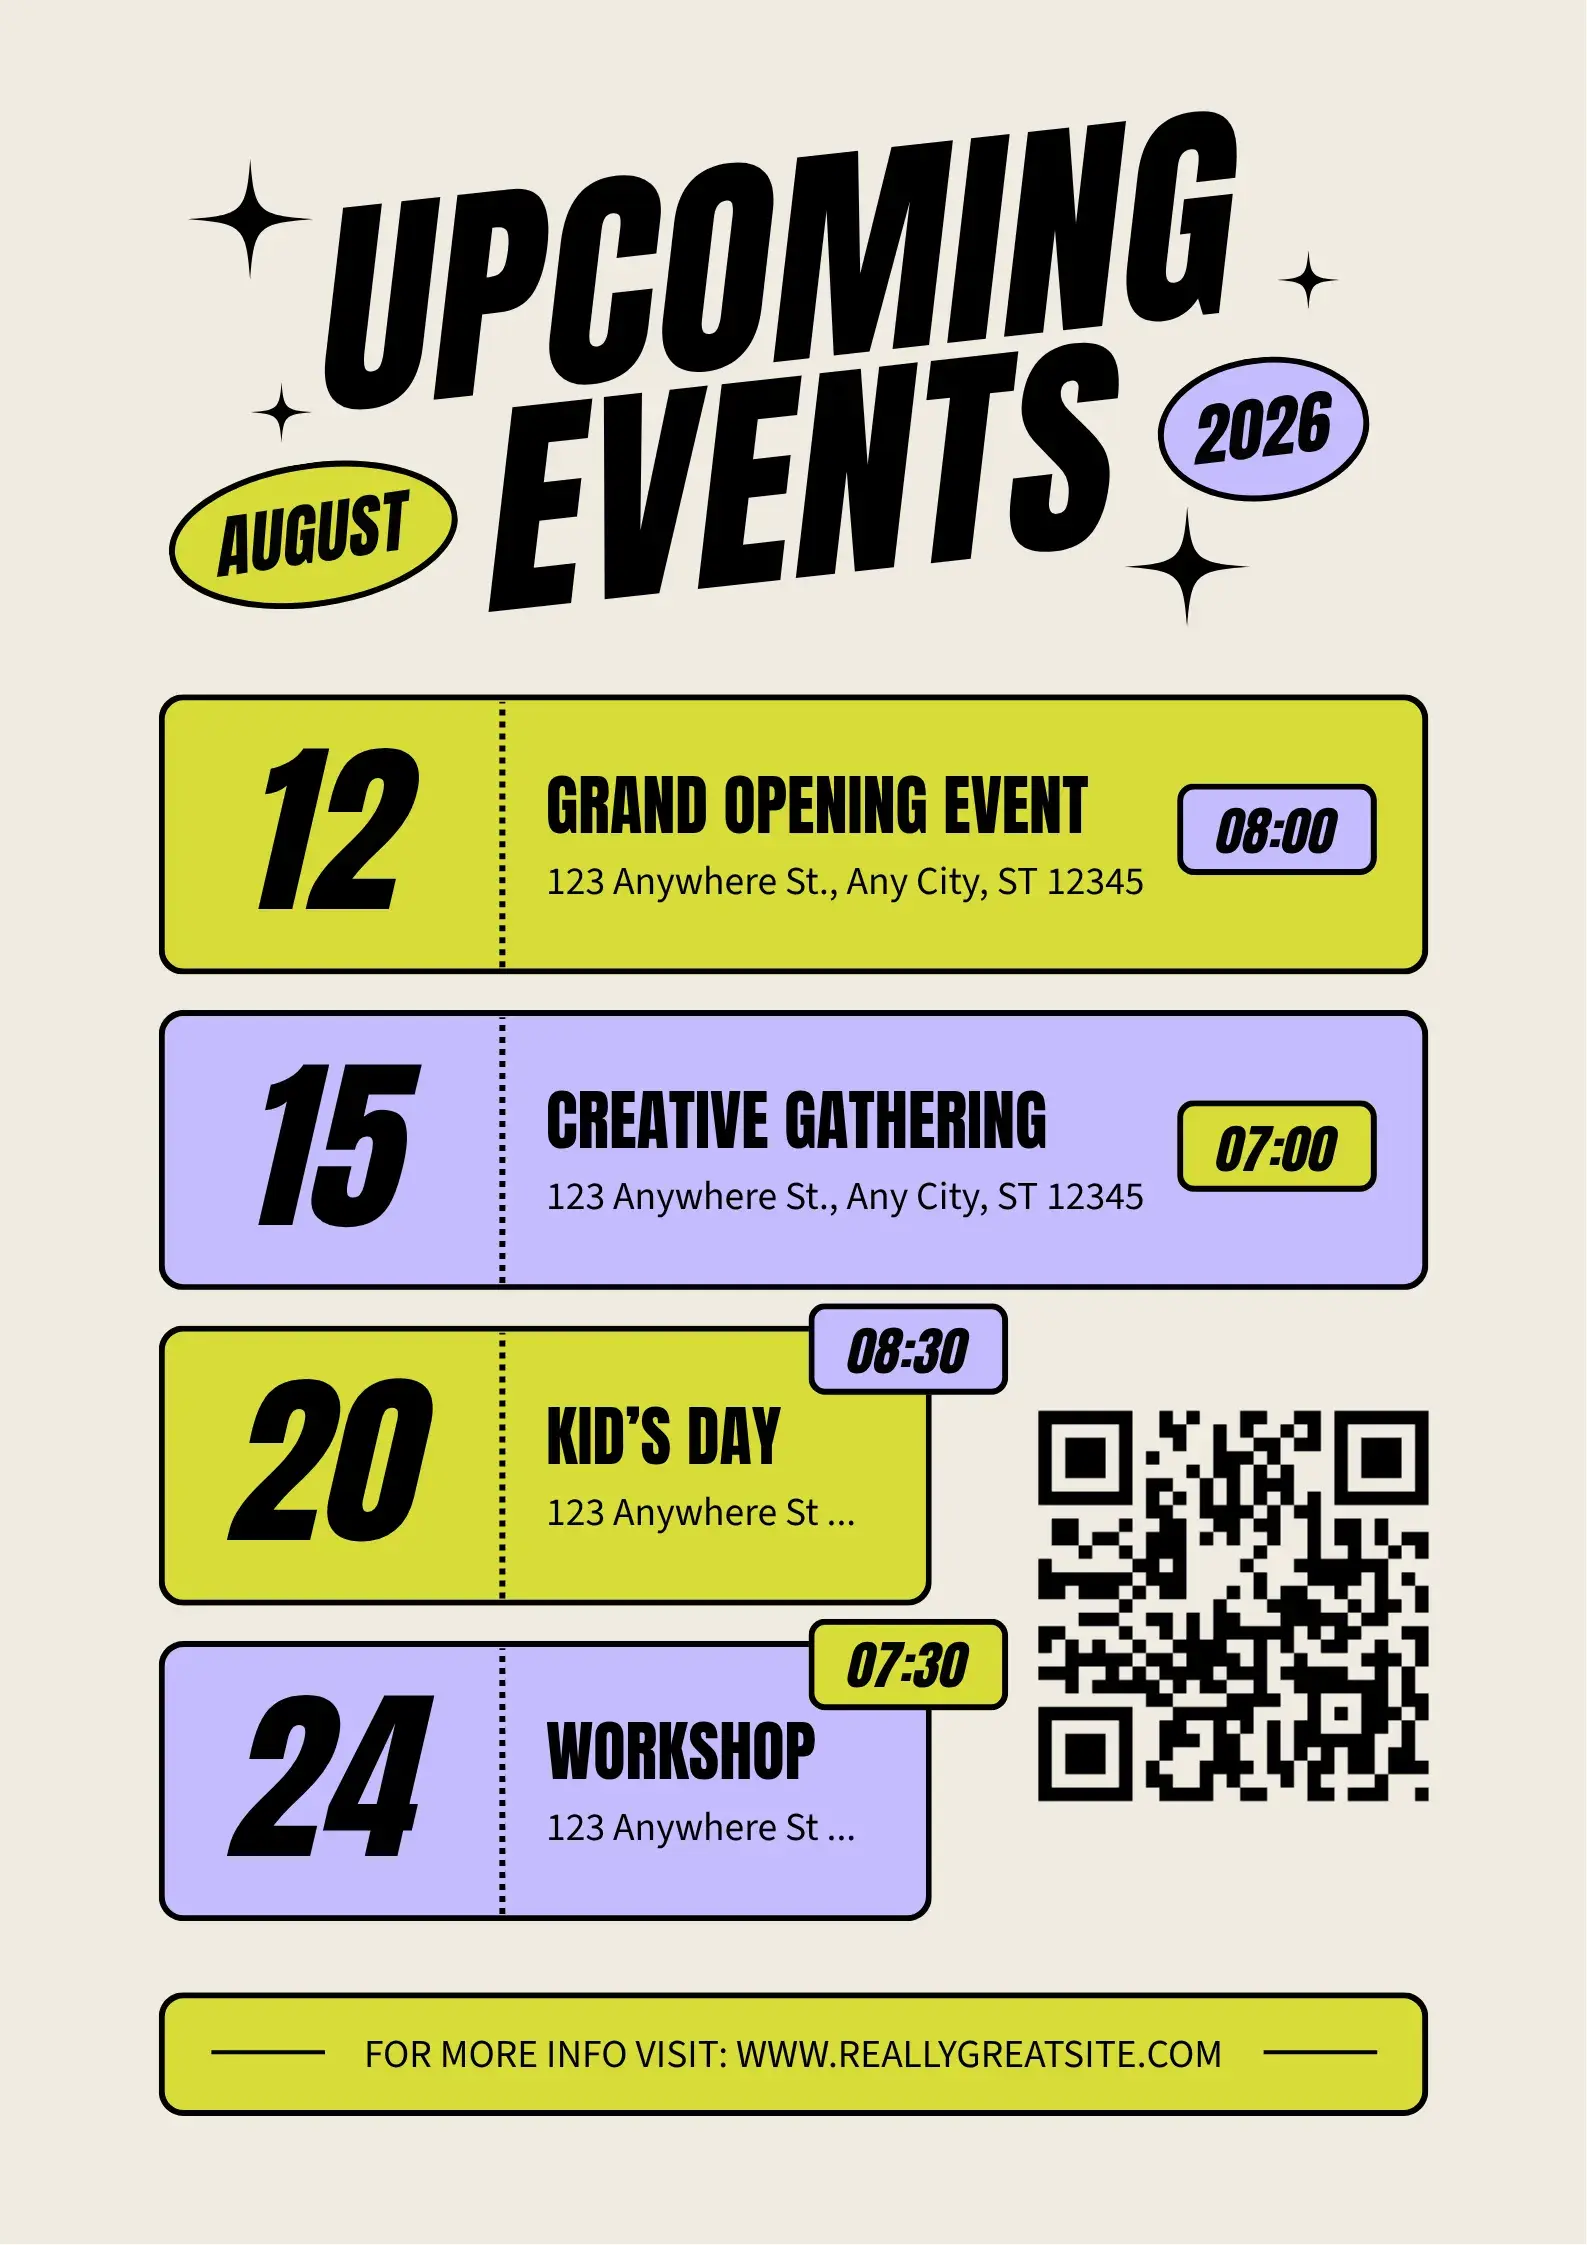
- Create a campaign, give us a link for what you’re trying to advertise, and position the created QR code on your poster page!
- Print of as many posters as you want, and register them by scanning their QR codes as you put them up.
- Sit back, relax, and watch the analytics roll in. Whenever one of your posters is scanned, you get a log telling you when and where.
The Analytics
Get real-time click through results, so you can see how interest is moving over time.
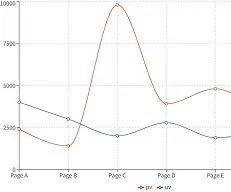
Gather A/B poster test results, so you can understand how different designs are performing with your audience.
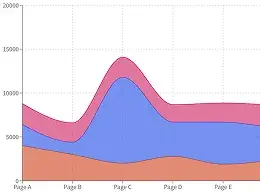
Find out which areas are hotspots where your posters perform the best.